


Car clubs commonly meet for a “chassis dyno day” to evaluate the latest upgrades on members’ cars. Unfortunately, the events tend to morph into boasting or complaining about the dynamometer (dyno) performance. Dynos do not make power, but could the dyno operator influence the performance numbers?
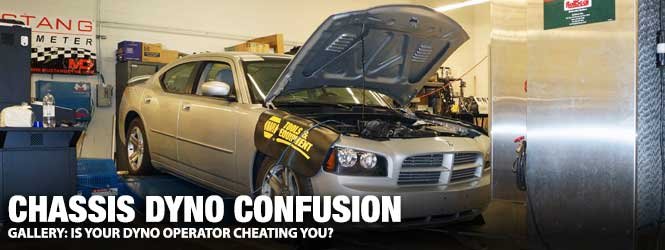
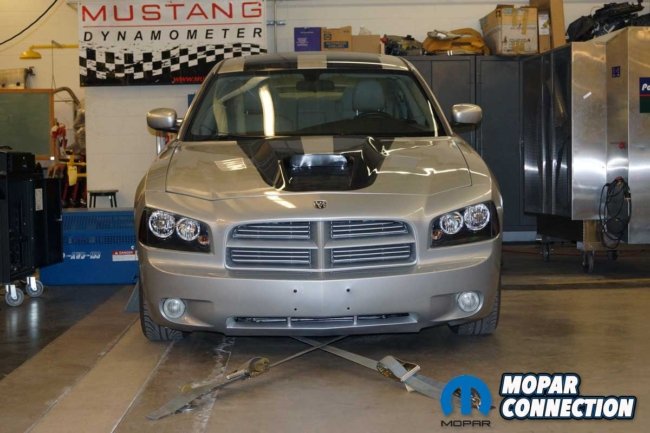
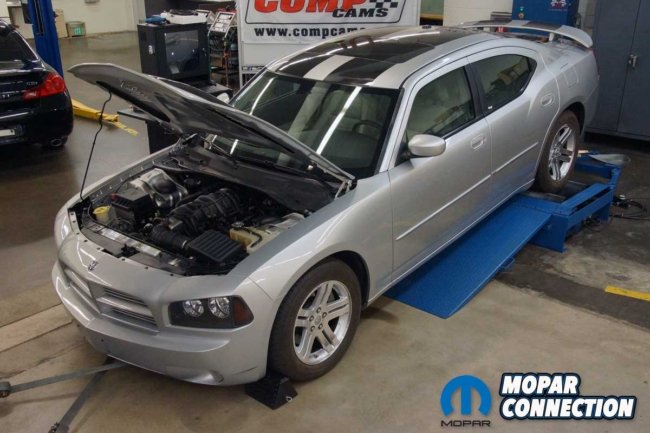
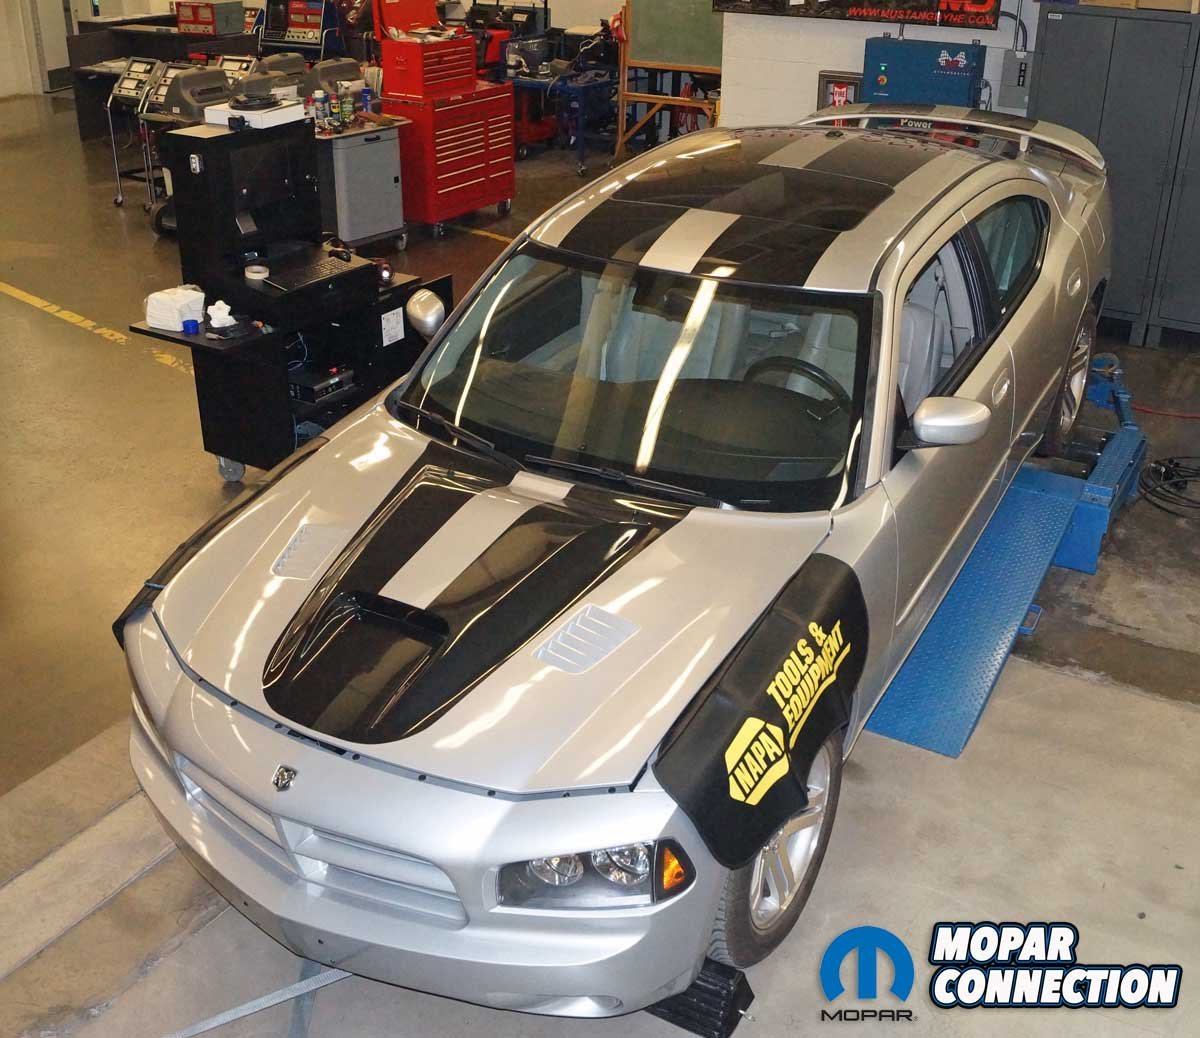
Above: Because so many things need to be clarified about what dynamometers (dynos) do, we decided to spotlight fourteen mistakes by dyno operators that can significantly impact the performance numbers provided by the dyno. We used Pennsylvania College of Technology’s eddy-brake Mustang Chassis dyno and its 2006 Dodge Charger R/T for our testing.
The above scenario plays out weekly. Therefore, fourteen tests were conducted with the Penn College Charger R/T on its Mustang Chassis Dynamometer to dispel misconceptions and enlighten enthusiasts on dynamometer operators’ mistakes and downright lies.
Irrespective of the dyno’s load type, it measures torque, and the software monitors the acceleration rate and speed of the rollers. There are three types of dyno load devices. One is an inertia wheel, which provides a fixed resistance load to the drivetrain.
However, a water-type or an eddy-current (electric) brake provides a more accurate variable loading method and delivers repeatable outcomes from run to run. The drive wheels of the vehicle spin against a programmed load applied to the dyno’s rollers. Therefore, water or electric brakes (like our Mustang dyno) are used when testing performance applications.
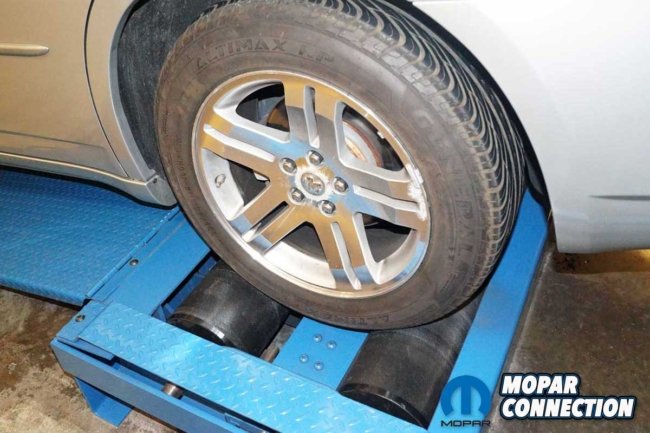
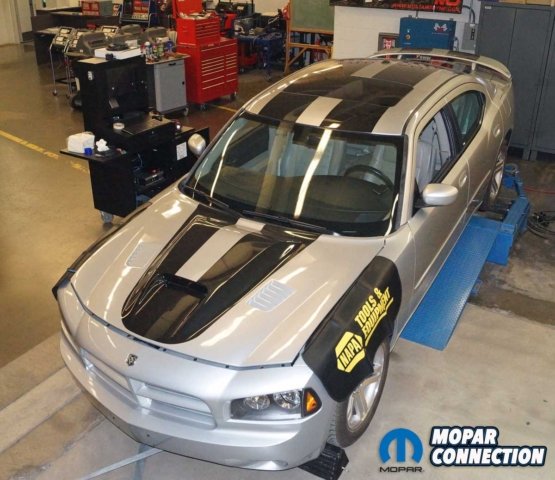
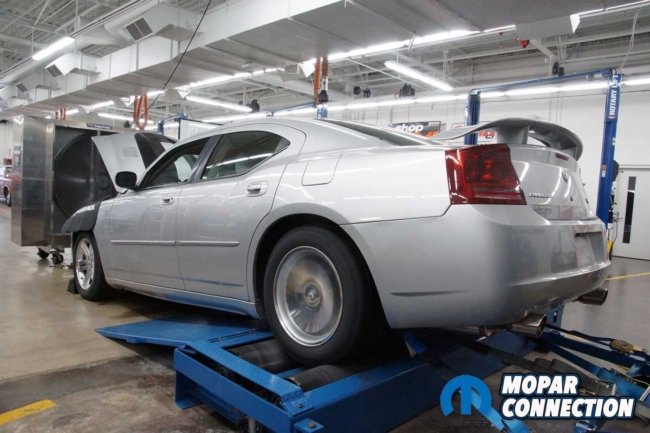
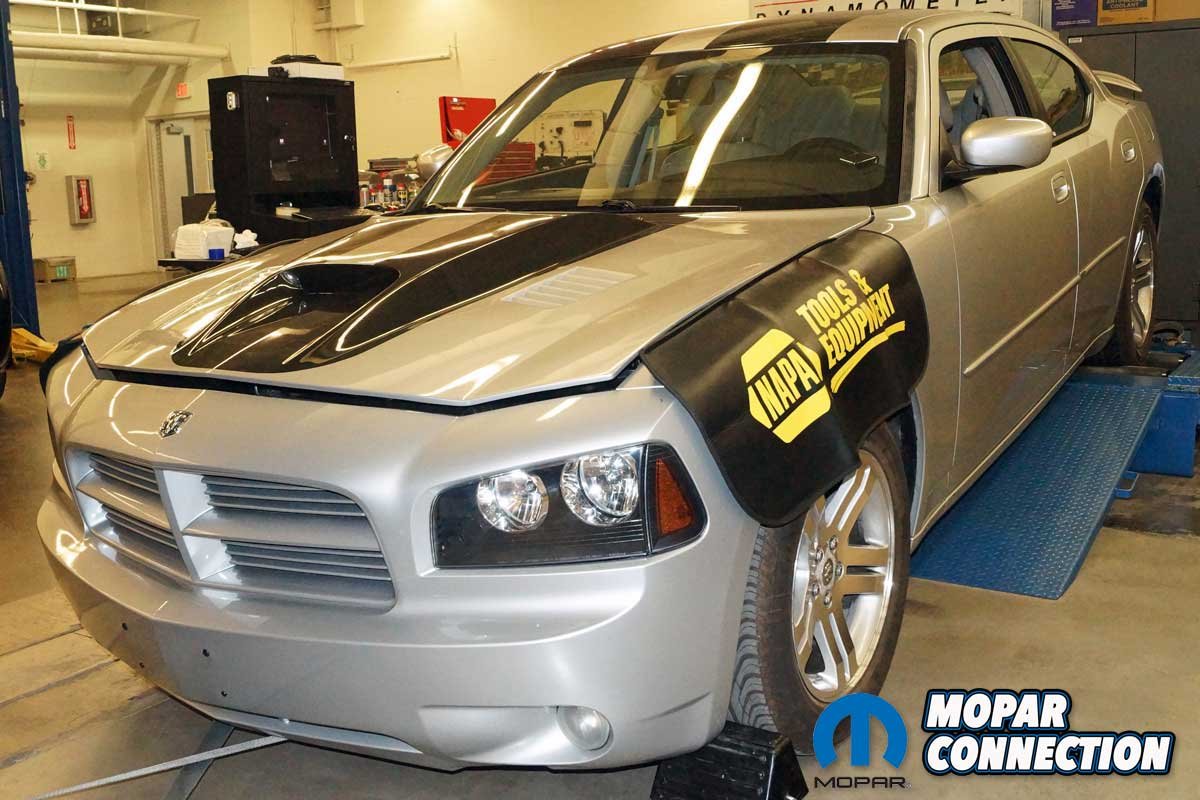
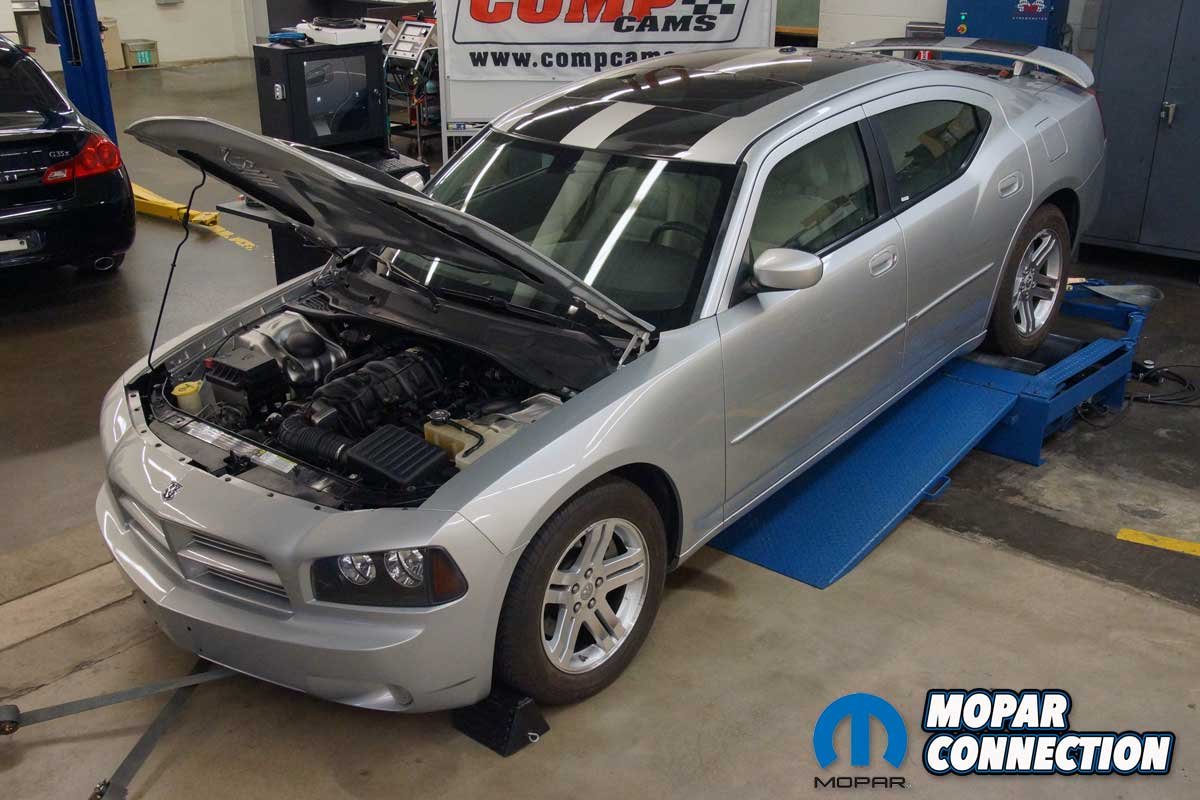
Left: The Penn College chassis dyno has a double roller design. We released the air to drop the center plate and lightly accelerated the Charger to center the tires between the rollers. Right: The Penn College Charger has a few bolt-on components but remains relatively stock, making it a great candidate for our testing. In addition, the Hemi has proven reliable; we have put well over 5,000 wide-open throttle runs on it over the years.
Before any runs can take place, the dyno must be appropriately calibrated, lubed, and in proper working order. If not, the performance numbers will be skewed.
To start testing, the Charger was backed onto the dyno, and then the center pad between the rollers was dropped (air released) to allow the drive tires to meet both rollers. Next, the Charger’s drive tires were settled on the rollers by lightly depressing the gas pedal and accelerating.
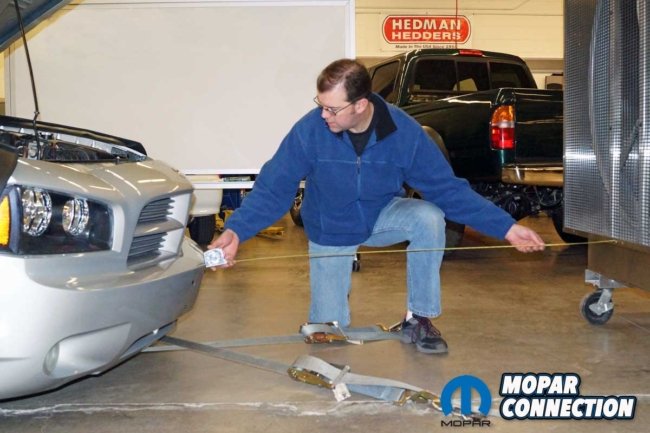
Once squared, the tie-down straps were crisscrossed and fastened to the front and rear lower control arms. An accessory drive belt gauge measured the tie-down strap tension in pounds. With the Charger secured, the driveline was warmed by running through the gears while on the rollers. At operating temperature, we adjusted the tire air pressure to 30 psi.
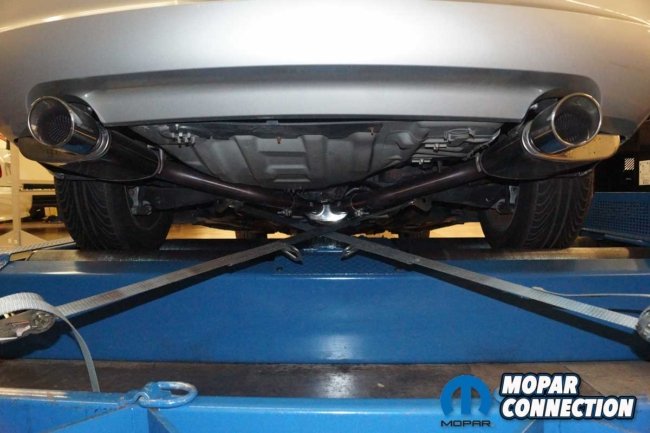
Left: We strapped the Charger onto the dyno with 10,000-lb tie straps. The front straps were attached to the lower control arms. Right: The rear straps were attached to the lower control arms. Rather than looping the straps over the control arms, we hooked the straps into holes in the control arms. On the front and the back, we employed a crisscross-style installation of the tie-downs.
We performed a parasitic load test by running the Charger up to 120 mph. Then, we moved the shifter to neutral, and the Charger coasted down. The test measured the drivetrain torque loss over the mph span.
We placed a seven-foot fan in front of the radiator, and the hood was opened. Three runs with a 1% or less difference in peak torque and horsepower would be used for each test series. We allowed a 2-minute cool-down period between each run with the engine fans and the external fan operating for accuracy and consistency. In addition, the weather parameters were entered before each run.
The baseline runs provided a peak of 356 lb-ft of torque and 339 horsepower (hp). The Hemi was run from 2700-5500 rpm for all testing. See the chart for all the run data.
With a valid baseline, the first test consisted of loosening the rear tie-down straps one-tooth at each ratchet. The results were a minimal torque and horsepower increase. Next, the rear tie-down straps were backed off two more teeth, and the added looseness increased the performance output but at the added risk of the tires “walking” freely on the rollers.
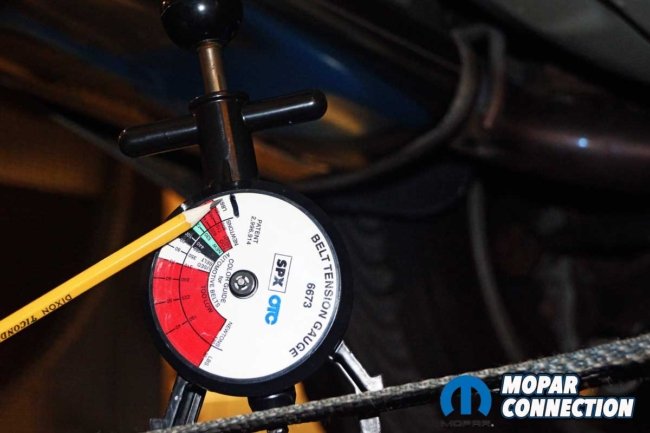
Above: We used a belt tension gauge to tension each belt correctly. Years ago, we marked the tool with a black line, which we use as our guide for proper tension.
The Charger was situated in a non-square position on the rollers for test three. The Charger was again tightened into place, with the rear over two inches compared to the front. After the runs, we noted a small torque and horsepower loss. However, the minor angle led to each rear tire leaving significant rubber debris on the chassis dyno.
For test four, we recentered the Charger, increased the tire pressure to 35-psi, and pushed the Hemi through more runs. The peak torque increased by 3.5 lb-ft, and the peak horsepower increased by 4.0. An additional 5-psi was added. The 40-psi tire pressure increased the peak numbers again. The peak torque rose 5.0 lb-ft, and the peak horsepower gained 4.5 hp.
However, we felt a vibration with the increased inflation pressure as the wheel speed increased beyond 95 mph. Therefore, we reestablished 30-psi for safety reasons. These two tests proved tire pressure deviations from the factory recommendations could sway the numbers.
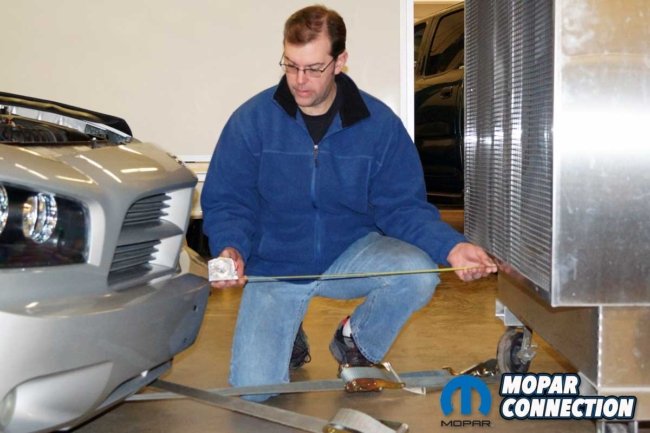
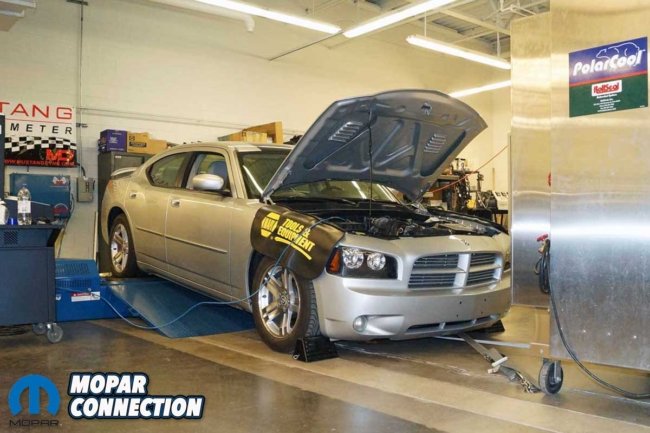
Above: We placed our huge fan 30 inches in front of the Charger’s bumper. The fan is one of the critical components needed to maintain acceptable, repeatable results. Without a fan, the horsepower and torque numbers fall rapidly as the engine temperature rises.
Thus far, all the dyno runs were performed with the hood open. For test six, we closed the hood but left the large fan 30 inches from the front bumper. The runs showed the hood orientation mattered little, as the performance changes were minimal.
For test seven, we removed the fan, and as expected, the fan is unbelievably essential. The peak torque and horsepower plummeted. With each successive run, the output of the Hemi dropped as the under-hood temperatures soared.
We reopened the hood and performed three more runs to recoup the losses. While the numbers did rebound, the overall numbers were still down without the fan. The peak torque was down 10.0 lb-ft, and the peak horsepower dropped 7.5 hp. To this point, only the fan significantly changed the results.

Left: Testing with the hood closed reduced the performance numbers, but not as severely as removing the fan. We prefer leaving the hood open during all the testing. Right: We moved the fan 60 inches from the front bumper. The extra distance slightly increased the output numbers.
We pushed the fan back 60 inches from the bumper for test nine. The fan’s maximum airspeed was only 21 mph, but a large volume of air was produced due to the size of the fan. The airflow volume maintained the coolant temperature. Regardless of the fan position (within reason), the fan was vital for repeatable data accuracy.
Thus far, we utilized the Society of Automotive Engineers (SAE) J1349 standard, used by most auto manufacturers. The standard corrects the current weather variables (ambient temperature, humidity, and uncorrected barometer) to a baseline of 77°F, 0% humidity, and 29.234in-Hg. The result of the three weather variables is a Weather Correction Factor (WCF) that allows a run to be compared with others without weather-influenced variations.
A change to the SAE J607 standard was selected for test ten. The J607 standard corrects the weather variables to 60°F, 0% humidity, and a barometer of 29.92in-Hg. When comparing the J1349 to the J607, a difference of approximately four percent is noted, with the J607 standard being higher.
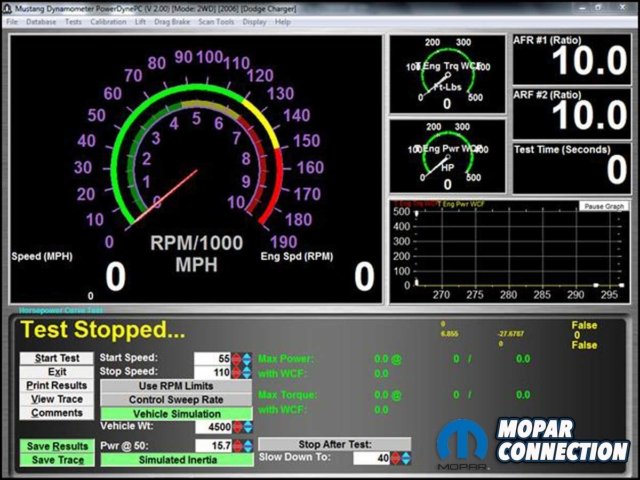
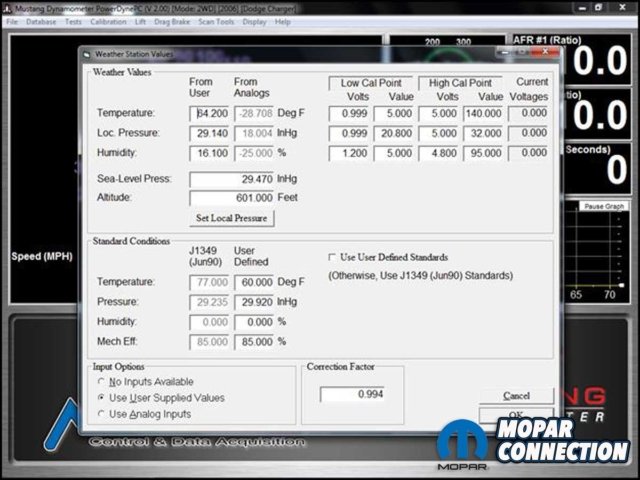
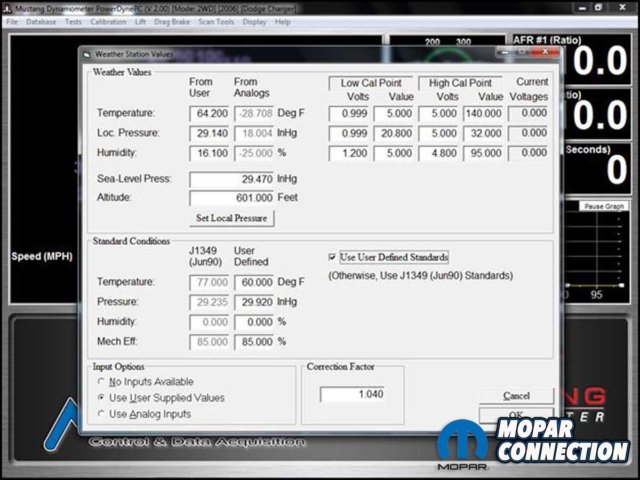
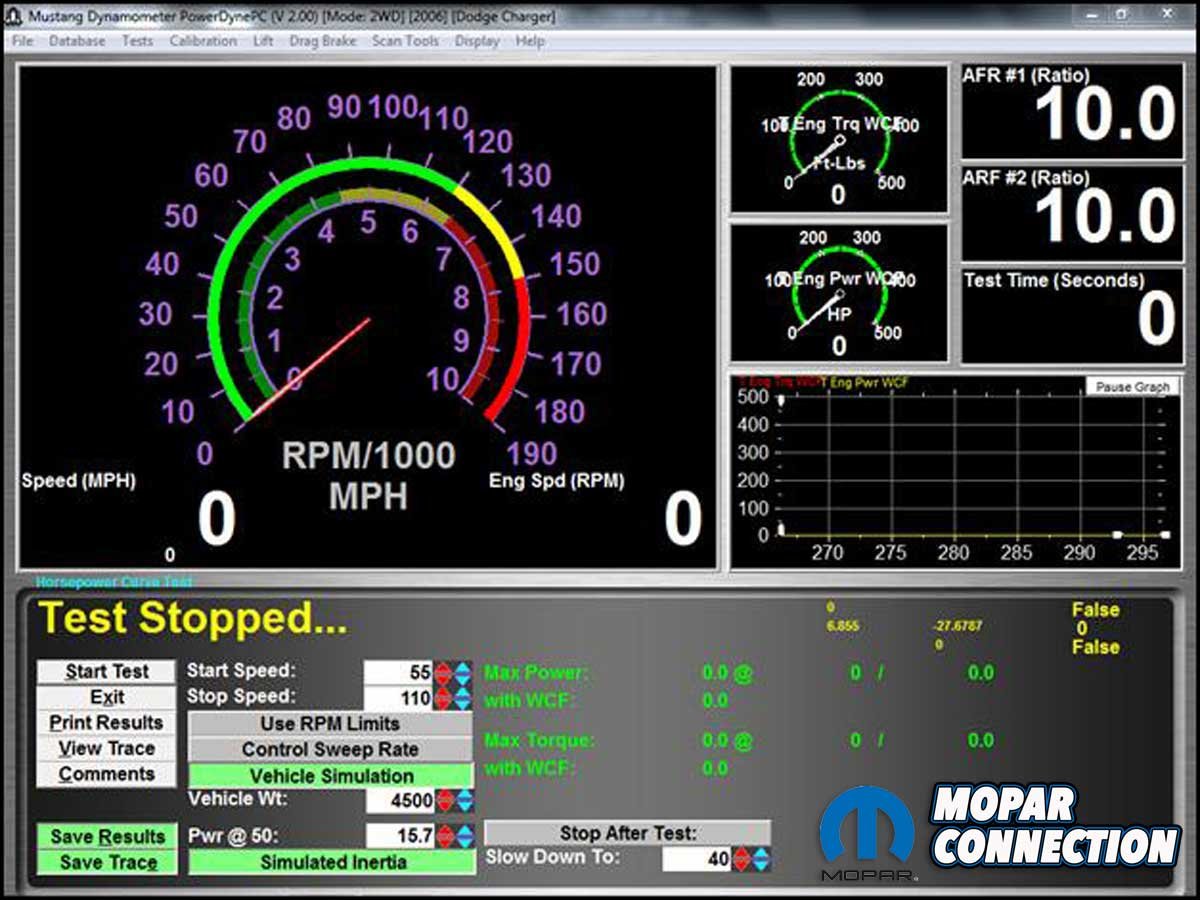
Left: The Mustang Power Curve page was set up for each run in third gear. We ran the Hemi from 55 mph to 110 mph, which was 2700 rpm to 5500 rpm. Mustang provides the vehicle weight and power at 50 mph numbers. Center: We used the SAE J1349 standard for all of the testing. It is the standard currently used by most automobile manufacturers. Based on the temperature, barometer, and humidity, the Weather Correction Factor (WCF) was 0.994. Right: We switched to the SAE J607 standard, and without changing anything else, the WCF rose to 1.040, a little over a 4% increase.
The standard selected by an operator can manipulate the data outcomes. For example, a baseline can be performed with the J1349 standard. Then, after loading a “tune” to the PCM, the operator changes to the J607 standard, thus guaranteeing a performance increase.
After runs in the baseline setup but using J607, the peak numbers were up 20.0 lb-ft of torque and 19.0 horsepower. So, the performance numbers are entirely legitimate, but they are based on a different SAE standard.
The next test was to use a generic parasitic load included in the Mustang dyno software instead of the one we had established at the beginning of the testing. No data was gathered to measure the drivetrain losses with the generic load. Instead, there was a static load applied to the rollers by the operating software, which was greater than the Charger’s tested parasitic load.
Above: For our final runs (before re-running the baseline runs), we set up the dyno to maximize the output by using every trick we found that had increased the output numbers. After a series of runs, the numbers were out of sight. However, they were also completely bogus.
The generic parasitic load hammered the numbers as the peak torque dropped by 37.0 lb-ft, and the peak horsepower plummeted by 46.5 hp. Suppose an operator had selected the wrong parasitic load or installed the previous vehicle’s parasitic load; the results would be incorrect.
An operator can easily manipulate the weather variables for increased numbers. For this test, the humidity and the barometer numbers were unaltered from the weather station, but the ambient temperature was increased by 60°F. The change raised the WCF to 1.082, and the performance numbers increased considerably. The torque soared up 33.5 lb-ft, and the horsepower gained 30.0.
Another area the operator may influence the test results is the gear selected for the testing. With the Charger’s transmission selector in fourth gear, the 160+ mph rear wheel speed easily exceeded the tire speed rating. Also, the speed limiter became bothersome, nearing the end of each run.
Above: To verify nothing had changed, we re-ran the baseline series of runs. The pre- and post-baseline runs matched, confirming that all our runs were correct. The Hemi punched a total of 48 runs in a period of a few hours.
We performed all the tests in third gear to address the above concerns. The performance differences between third-gear and fourth-gear runs were negligible. The 2800 rpm span completes in about 11 seconds when in third gear; that equates to about 250 rpm/second. The data is informative without overstressing the engine or causing excessive eddy-brake heat that could skew the results.
Although third gear produced acceptable results, a test in second gear was less successful. Each run should be completed in 6-15 seconds, but the 2800 rpm range in second gear was covered in about 4 seconds with reduced output numbers.
The last runs were “Hero Runs,” which combined the bests from the previous tests. The hero runs produced a 44.5 lb-ft peak torque increase, and the peak horsepower was 42.0 hp. Unfortunately, while the dyno crowd embraces these numbers, they are fabrications with zero credibility.
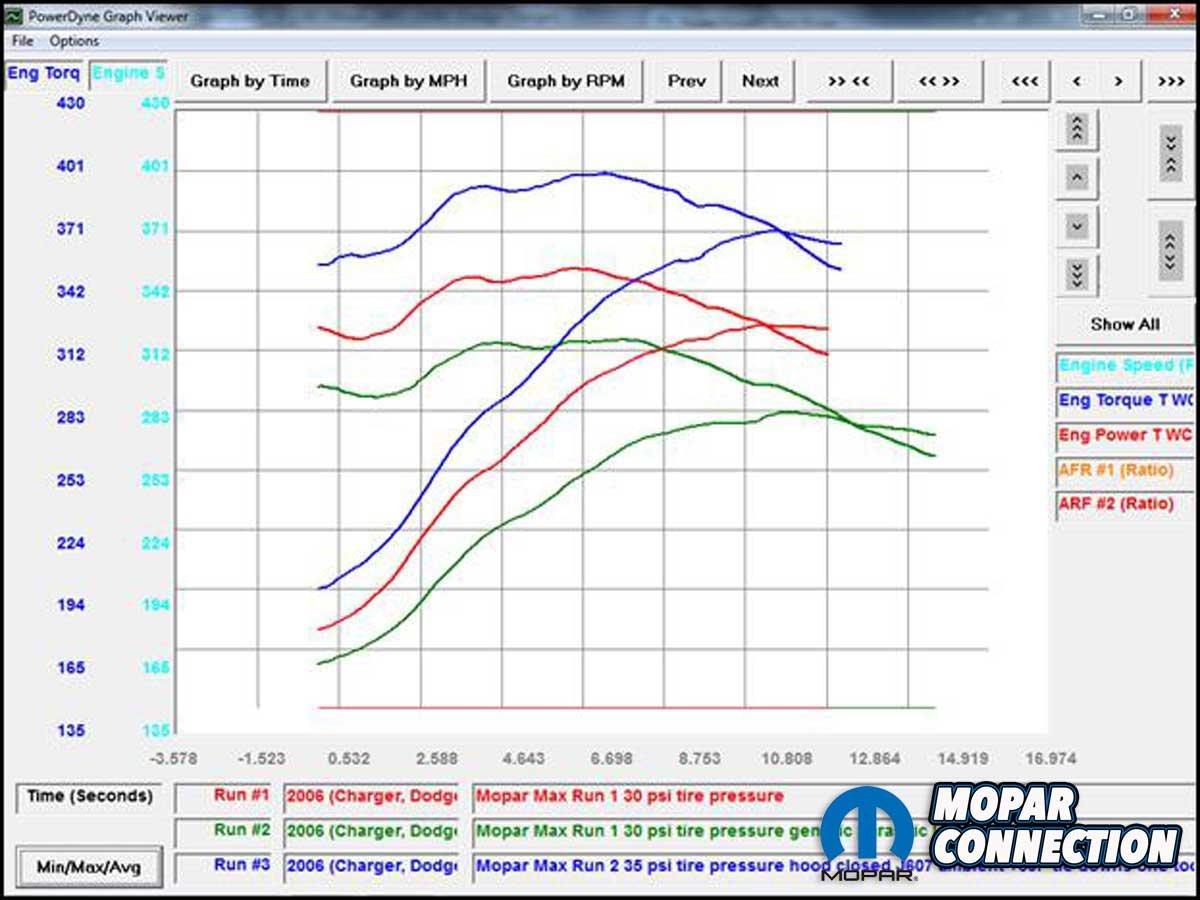
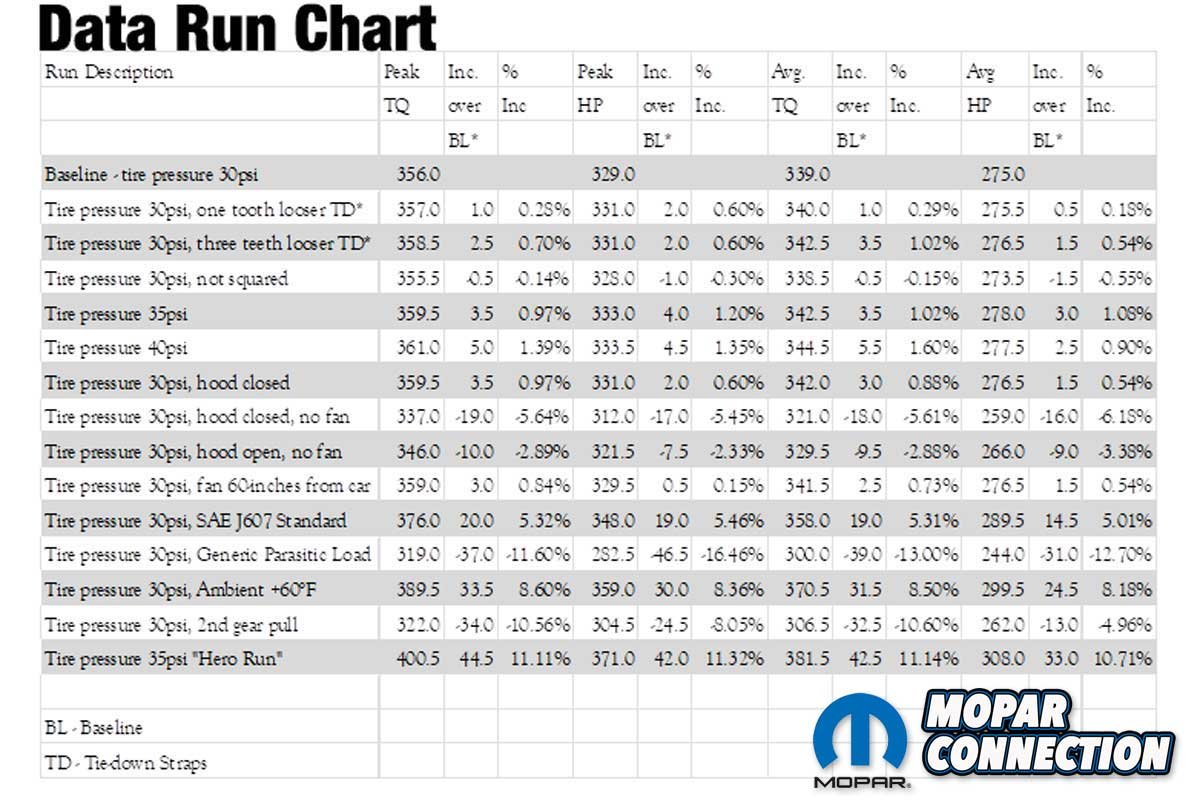
Left: The three power curves represent the baseline runs (red), the Mustang preset parasitic load runs (green), and the hero runs (blue). The worst runs (green) took an extended time to complete. Without changing anything on the Charger, we had over 80 lb-ft and 88 horsepower differences based on how the runs were set up. For information, the torque starts at the top of the page (left), rises, and then drops. Horsepower starts low (left) and rises until about 5300 rpm. At that point, it begins to fall. Right: We put together a chart of all our tests. We included the peak torque and horsepower and the average torque and horsepower. We also recorded the improvement or reduction in the performance outputs in the chart.
The tests showed a variation of 81 lb-ft of peak torque and a deviation of 88.5 peak horsepower. The dyno operator can generate these differences through ignorance or monetary motivation. Dyno days offer inexpensive, quick hit runs that may or may not provide the customer with accurate, usable data.
A dynamometer is a tool that is only as good as the operator. So regardless of the horsepower on tap and the corroborating dyno printouts, the proof is displayed at the track when the hammer drops and elapsed time slips are handed out.


