Dyno numbers seems to be a big topic this day. At times its almost as if racing on the track does not matter, people just want to have the bigger number on their dyno sheet. In racing, a dyno sheet does not really mean much, but that is not what we are here to talk about.
Not all dyno runs are created equal. Two cars on the same chassis dynamometer or one car on two different dynamometers can bring forth a flurry of foul language and confusion as to what car is making what horsepower and where.

There are a ton of factors that play into how the dynamometer interprets the inputs from your vehicle to calculate your horsepower and torque numbers. We have been told that there are little tricks that dishonest shops can do to trick the dyno into calculating higher numbers than it’s supposed to. That is why you should only trust experts like Hughes Engines to give you the most accurate readings.
Dyno results must be interpreted carefully as each component of the drivetrain plays a key part. The transmission, for example, is especially important. Hughes Engines took a deep dive in to how a performance curve can change just based on the gearbox beneath. Their succinct understanding of the total package is exactly why they have been and will continue to be the Mopar performance experts.

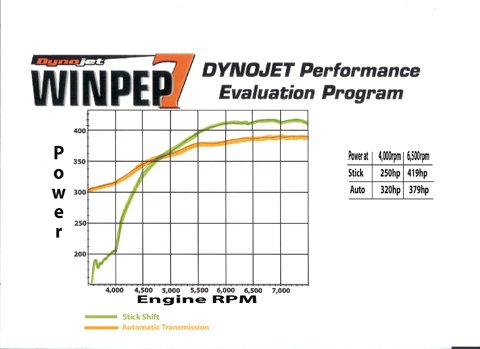
Above: Test 1 was with a standard transmission. Test 2 used an automatic transmission and torque converter with a 4000 RPM stall.
Chassis dyno numbers; the accuracy or relationship of power outputs from one dyno to the next is close to non-existent. I would guess more arguments are now started based on chassis dyno figures than any other subject gearheads deal with. We have one customer who is not happy with our parts and service because his car does not chassis dyno as much as his buddy’s car.
Yeah, they each tested on different dynos and my customer is 6mph faster and .4 seconds quicker than his buddy in the 1/4 mile, but he is still not happy – duh! And you thought people would be reasonable if you told them the facts – yeah right! And that’s not all; shown below are 2 chassis dyno curves. Same car, same engine, same rear axle, same dyno. The only difference was the transmission.
Note that the stick shift car with its positive coupling between the engine and axle showed a power curve we would normally expect to see. It starts out low and increases as the RPM goes up. The automatic, or more correctly the converter equipped car, multiplied the torque as it is supposed to do at the lower end and lost, or slipped, at the top end.
The stick car showed 250HP @ 4000 and 419HP @ 6500RPM while the automatic showed 320HP @ 4000 and 379HP @ 6500RPM. As a matter of fact the E.T.’s were similar and the stick car did show more miles per hour. If the axle ratio or tire size had been changed then the curves would have been different again. This example shows how each combination does its work differently.
The point here is that chassis dyno figures are good for testing purposes only. You cannot use the numbers from one dyno to the next. The Society of Automotive Engineers (S.A.E.) has recently instituted new engine dyno testing procedures for new car engines. There is now an independent 3rd party observer involved in the testing.
Not that the factories would fudge the numbers any or forget to install the air cleaner, mufflers, and alternator just to sell a few more Corollas or Scions. Come on – get serious; who would do that? Ah yes, the horsepower race is alive and well. I love it!


